Show Notes
The impact of the COVID-19 pandemic on our lives has been dramatic—and one area where we’ve seen this is in the unprecedented decline of traffic volumes on the nation’s roads. Almost overnight, highways that would normally see gridlock for multiple hours each day were deserted. Subway and bus platforms were empty. Not even the oil crises of the 1970s or the 2009 great recession saw anything remotely similar.
At RK&K, we understand the implications of these dramatic change in travel behavior. Less traffic means reduced fuel tax and toll revenues, which can impact funding of transportation projects. A sustained and permanent change in travel behavior may change how we plan for future projects and address long-term transportation needs.
Using a variety of conventional and “Big Data” sources from a number of states in the mid-Atlantic, in the RK&K Traffic department, we took a deep dive into current traffic patterns.
In the months since COVID-19 first became part of our daily routine, we have seen a gradual return of traffic to our streets. The morning and evening traffic reports on the local radio station have begun to mention the usual congestion bottlenecks again, and perhaps Waze and Google are no longer sending us on the shortest route to our destination.
But is everything truly getting back to normal?
Using a variety of conventional and “Big Data” sources from a number of states in the mid-Atlantic, in the RK&K Traffic department, we took a deep dive into current traffic patterns to better understand how travel behavior is changing. Our findings were revealing.

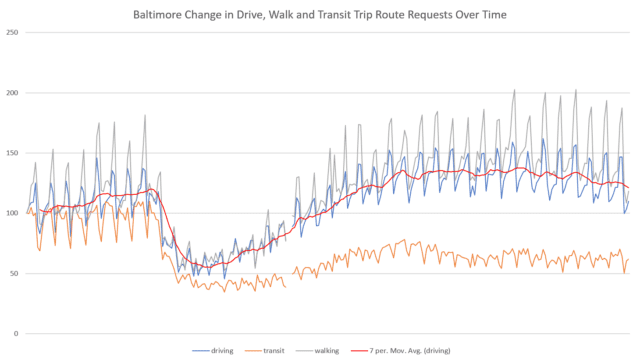
Baltimore Change in Drive, Walk and Transit Trip Route Requests Over Time (Source: Apple Mobility Trend Reports)
If one were to look at daily traffic volumes only, we might conclude that traffic has recovered to 85 or 90 percent of its pre-pandemic level. In a lot of areas, weekend travel has fully recovered.
However, the distribution of travel throughout each individual day remains different. Morning peaks are substantially lower, while evening peaks are close to normal—this may indicate that trip types during the day are changing from commuting trips to recreational trips. The peaks are shorter in duration, and most of each day’s travel is compressed in fewer hours.
Areas that rely on manufacturing or industrial employment, health care, hospitality/retail, or any other job that requires people to be on-site experienced a more rapid return of traffic.
There are regional differences, too: travel in heavily urban areas (such as the Baltimore-Washington corridor) remains substantially below pre-COVID levels, but in rural and tourist-dependent areas, travel during the summer appeared almost normal. Land use may be a factor—urban areas typically have a large proportion of office employment, which can adapt more easily to working from home. Traffic in those areas remains low. Areas that rely on manufacturing or industrial employment, health care, hospitality/retail, or any other job that requires people to be on-site experienced a more rapid return of traffic.
(Source: CBS Baltimore)
Although personal travel declined, truck traffic generally did not experience the same impact. Continued demand for goods and increases in home deliveries resulted in a smaller initial truck volume decline and a quicker return to pre-COVID levels; in fact, several locations now report truck volumes above historic levels.
Big Data analysis, based on cell phone and GPS location analysis, confirms the number of work trips per person in mid-Atlantic states remains depressed, but that non-work travel, following a slight decline during the initial stay-in-place directives, has generally returned to pre-COVID levels. Cell phone-based route search requests indicate a significant drop in transit use, with a possible shift of “choice riders” to single-occupant vehicles.
Whether it’s data collection, finding and using historic data, or Big Data analysis, our team of responsive traffic professionals understands the challenges ahead.
It still seems early to predict with any certainty what the future holds. Will we continue to see outbreaks that affect local and regional travel? Will a vaccine allow kids to return to school, or encourage everyone to return to the office, their favorite restaurant, their favorite vacation destination, or get together again with friends and family? The data indicate that recreational travel is bouncing back quicker than work/commute travel. Will commuters switch from public transit to single-occupant cars, and cause even greater gridlock down the road? Routing data suggest that commuters are leaving transit where possible. Will we have to recalibrate how we forecast future travel demand, if it is more leisure-driven and less employment-driven?
In these uncertain times, RK&K is ready to help our clients navigate the new traffic landscape. Whether it’s data collection, finding and using historic data, or Big Data analysis, our team of responsive traffic professionals understands the challenges ahead. We have shared the results of our analyses with several clients, and developed methods to continue traffic work while the pandemic continues to affect travel behavior. Together, we will craft the best and most appropriate approach to address your transportation needs.
